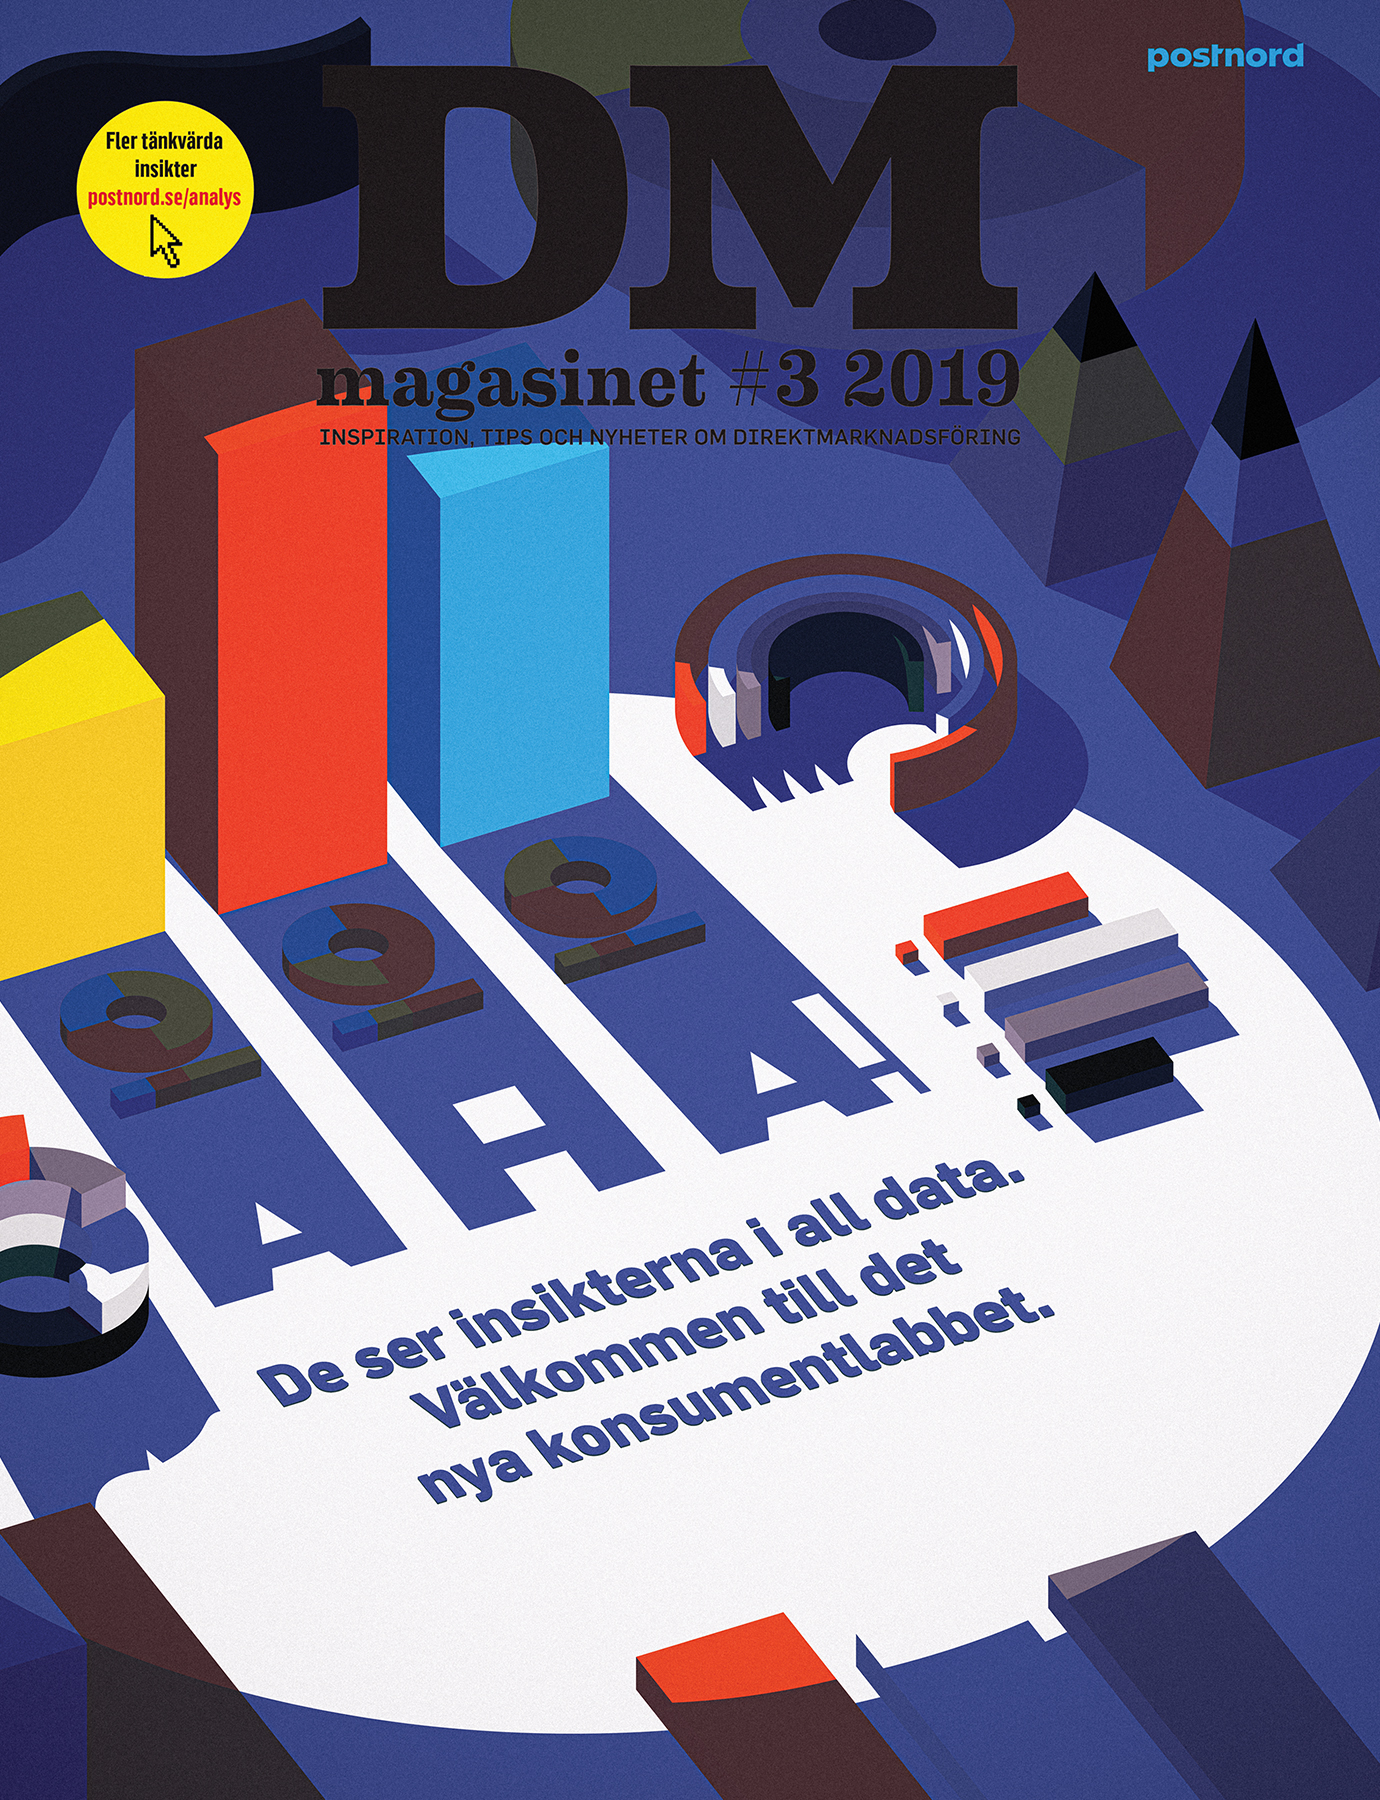
Data and new insight on how data works and what it tells about the consumer and the customer. An illustration made for PostNords magazine DM inspired by the program Qlik. Column diagram, circle diagram in a stylised graphic with light and color.

GRAPHICAL , Infographic , Editorial , Graphic
A cover illustration for Postnords magazine DM about data.
Client: PostNord     Agency: Spoon

Data

Illustration.